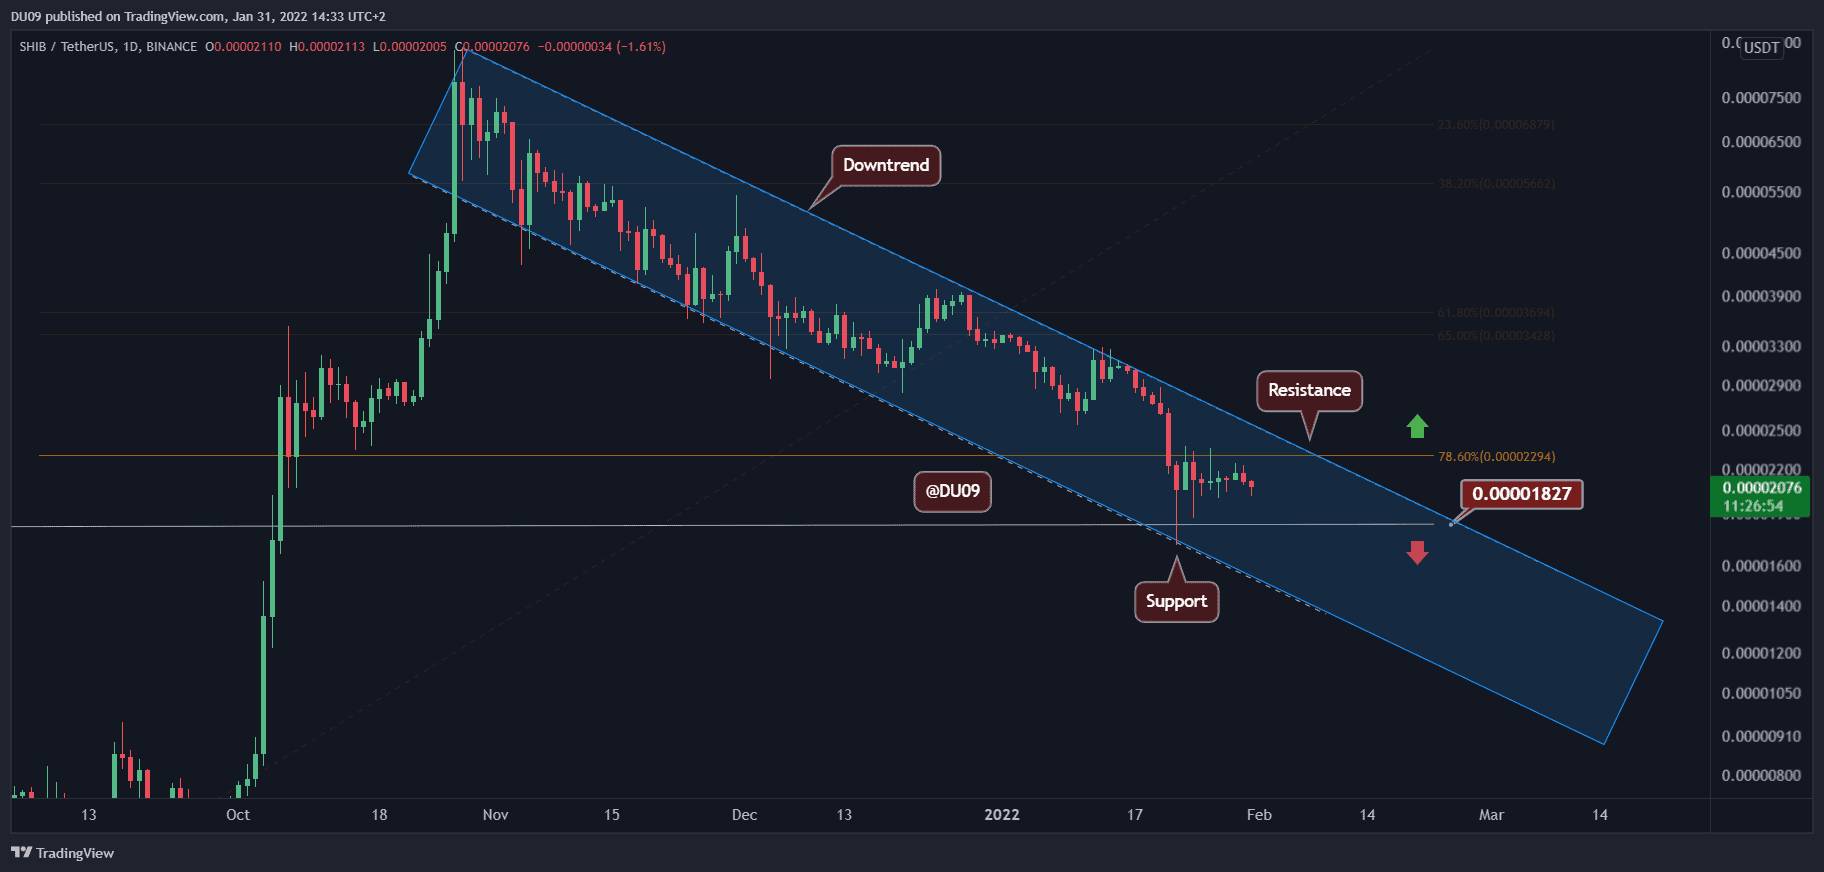
SHIB has been consolidating over the past week; however, no strength is witnessed in order to push the price higher. Looking at the mid-term timeframe, SHIB has been trading inside a descending trend-line since recording its ATH.
Key Support level: $0.000018
Key Resistance level: $0.000023
Shiba Inu’s native token has failed to push higher, suffering from a lack of buyers as the SHIB price is trading beneath the key resistance level of $0.000023.
The next major support level is found at $0.000018, the same level that was tested on January 22. The price sentiment remains weak and shows no conviction from the bulls.
Technical Indicators
Trading Volume: Volume has disappeared. After the most recent sell-off, there was barely any significant volume, as the price has moved sideways.
RSI: While the daily RSI managed to leave the oversold area, it did not have the momentum to push much higher, hovering just above 30 points. If buyers don’t get back to SHIB, then the RSI may see another drop into the oversold area.
MACD: The daily MACD gives signals of a possible bullish crossover, but due to the lack of momentum and volume, such cross has to be taken with a grain of salt as this can turn into a fakeout. Volume needs to pick up on any bullish price action to have any confidence in it.
Bias
The bias on SHIB is neutral: SHIB is stuck in a flat sideways action with not much bullish momentum or any signs of volatility.
Short-Term Prediction for SHIB Price
SHIB has lost its sparkle since recording its all-time high of $0.00008616 on October 28, 2021. SHIB is now trading 75% below its ATH price, attracting very little interest from market participants. It needs to leave the current price range in order to attract buyers.
A break of the critical resistance at 0.000023 appears unlikely now; therefore, the price may continue sideways for a while.