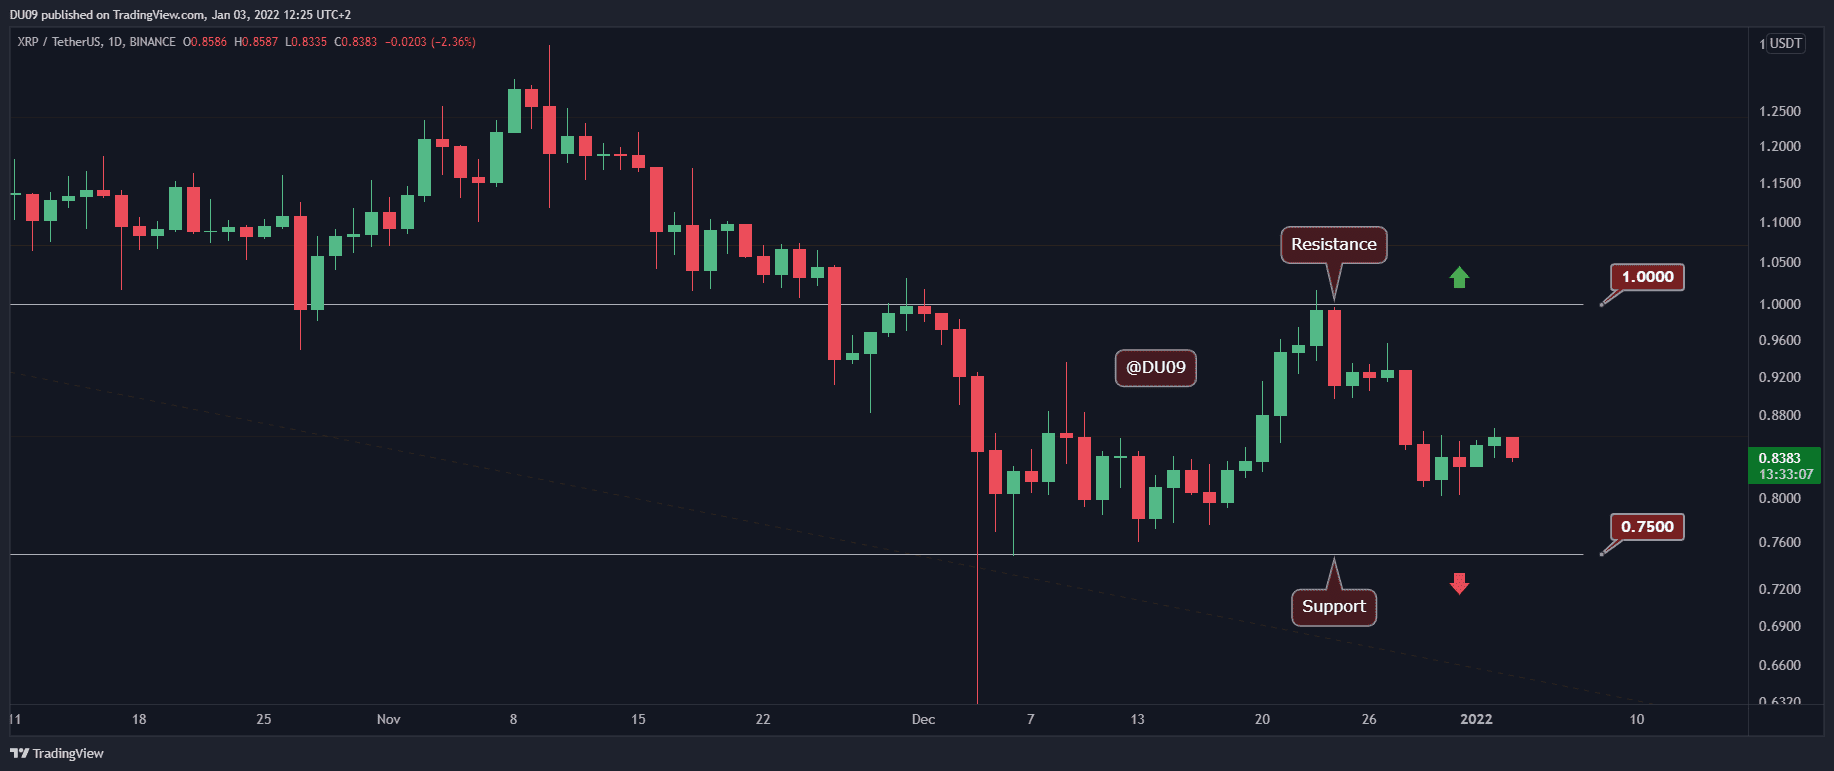
Key Support levels: $0.75
Key Resistance level: $1
XRP started this week with a 2% fall in price after a red opening across the crypto market. The correction that started on December 24th appears to continue. XRP has good support at the $0.75 level, and the price is slowly moving towards this area of liquidity.
When the critical support level was last tested, buyers came back in force. The question is if this can happen again. The key resistance is quite some distance away from the current price as it sits at $1.
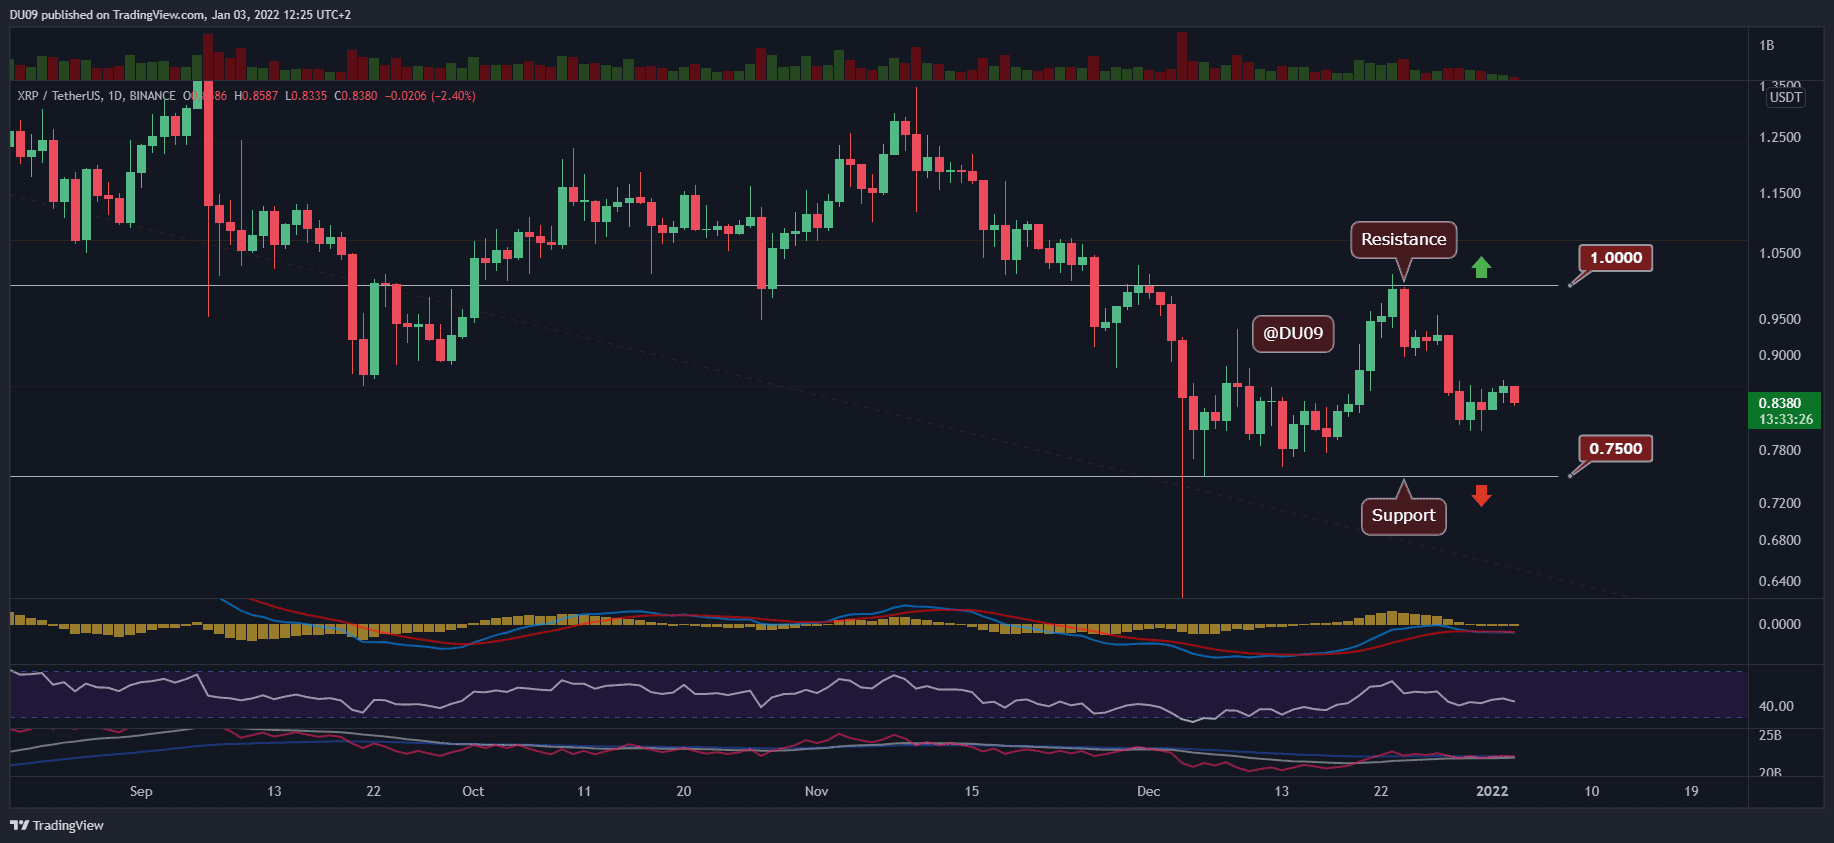
Technical Indicators
Trading Volume: The volume has simply vanished over the weekend, and it’s extremely low at the time of this writing. For this reason, the volatility is also low, and the price may take quite some time to reach the key support level if the bearish trend maintains.
RSI: The daily RSI is falling and may make a lower low if this continues. If the key support holds well again, then recovery becomes possible.
MACD: The daily MACD did a bearish cross last week, but due to the low volume, there is hardly any momentum behind this cross.
Bias
The current XRP bias is bearish. A test of the critical support is very likely at the time of this post.
Short-Term Prediction for XRP Price
XRP was sharply rejected by the $1 resistance in late December, and it has so far failed to recover from that, with the price slowly falling back towards support. The current action seems rather pessimistic.