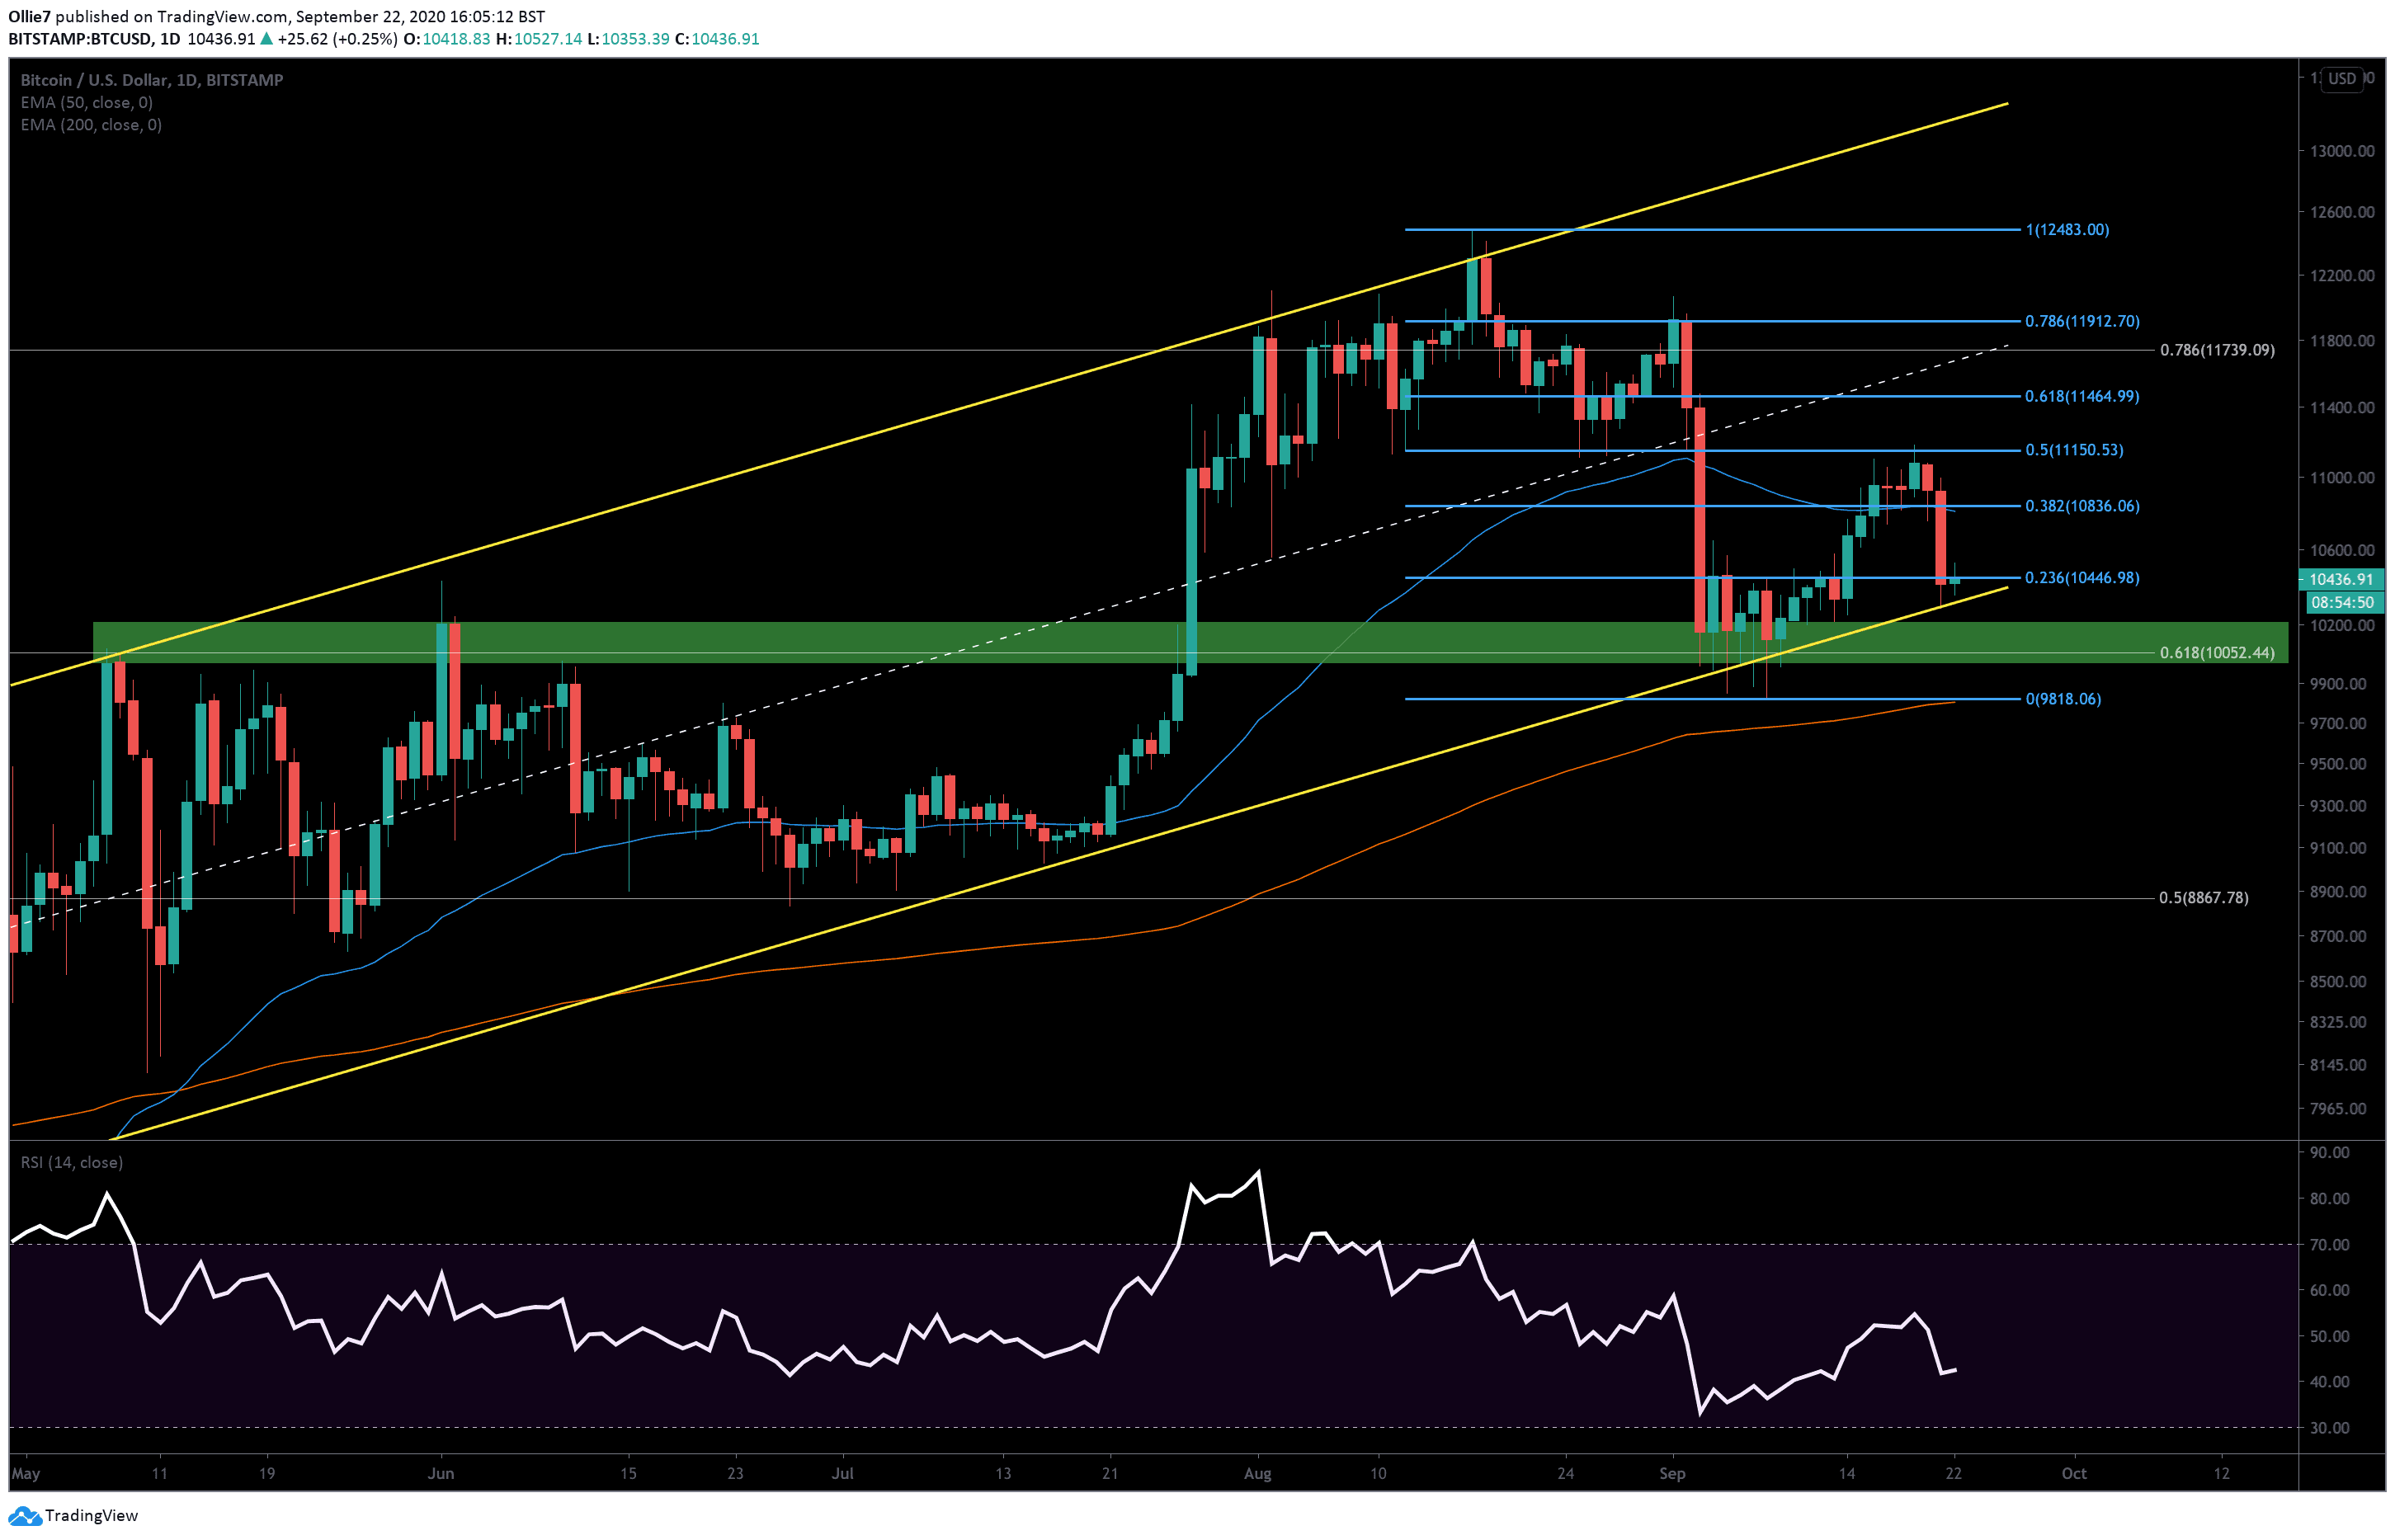
Bitcoin has returned into its former range between the 0.236 Fibonacci level at $10,446 and $10,000 after prices crashed a further 3% yesterday, around 15:00 (UTC+1).
This was the level that took over nine days to successfully clear earlier in the month and could keep prices suppressed again if volume remains low. On the 4-hour timeframe, we can also see long wicks above the last four candles, which suggest bears are defending this strong resistance level vehemently.
The unfilled CME gap below is now looking like a possible threat once again if BTC bulls fail to recover from this period of consolidation.
Price Levels to Watch in the Short-term
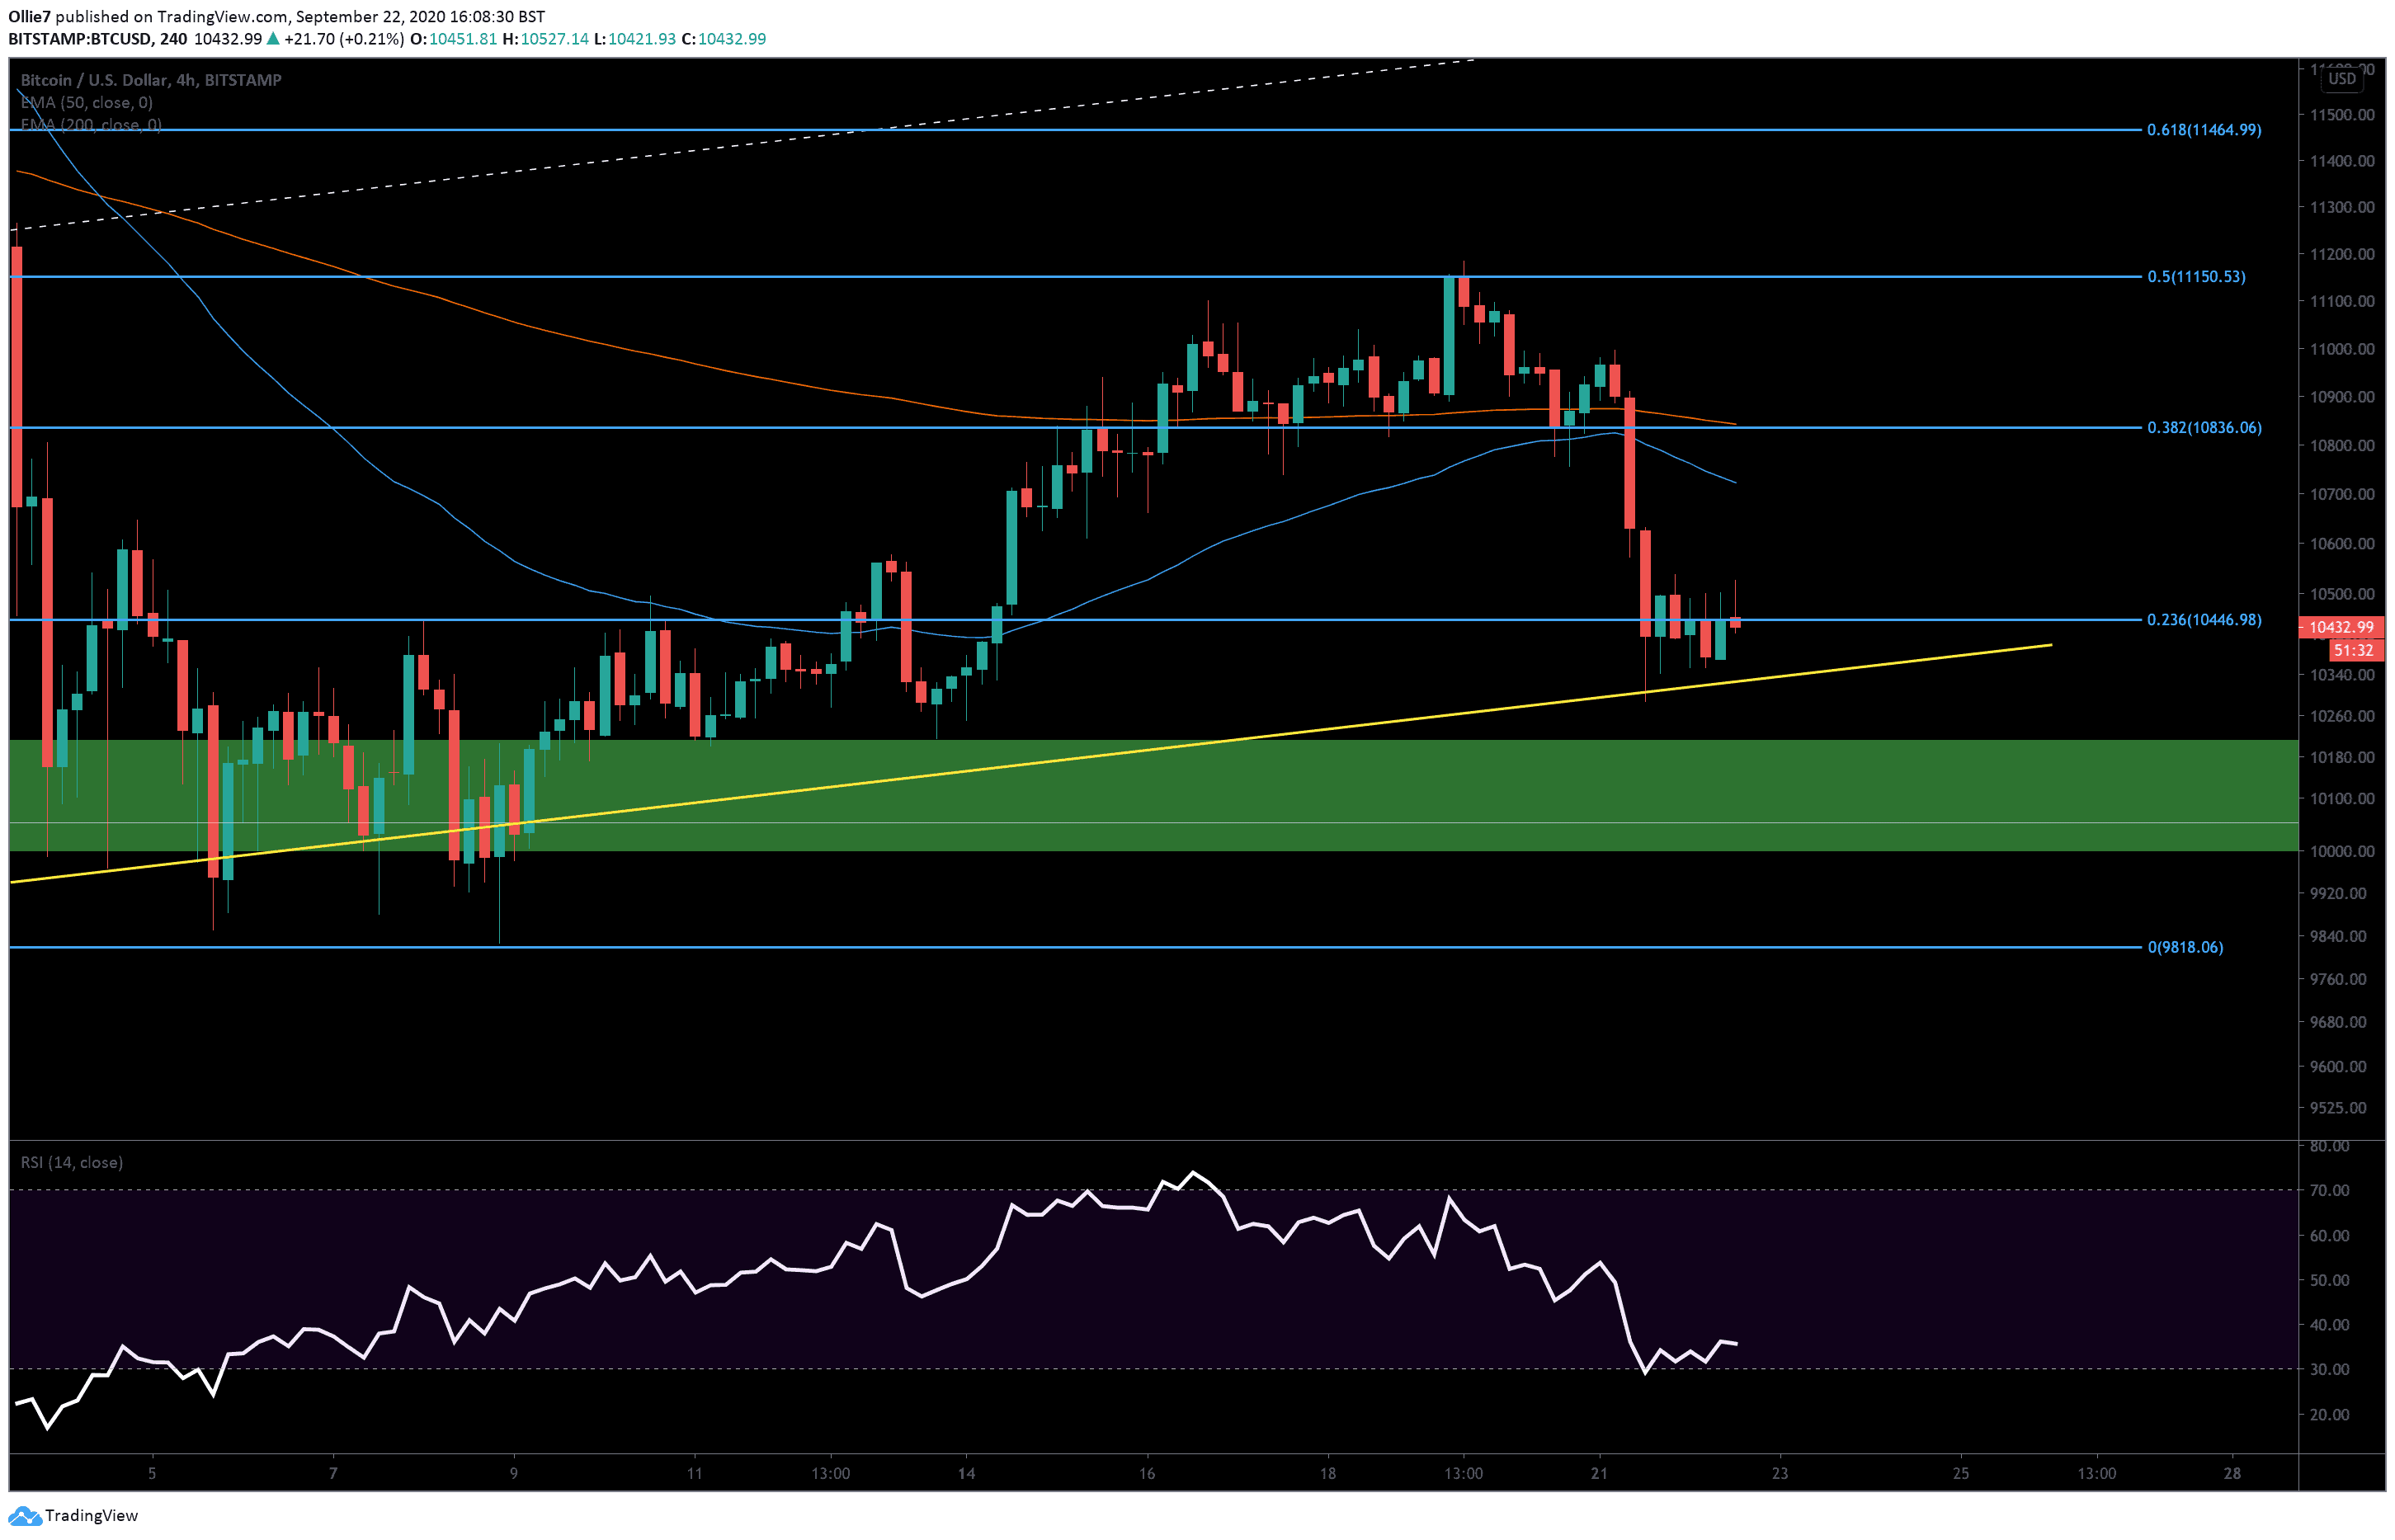
Right now, all eyes are on BTC closing above the 0.236 Fibonacci level on the 4-hour chart at $10,446 and breaking out of the range early. From there, the next likely bull target above would be the $10,580, which has consistently been a key S/R level for BTC since July 28, 2020.
Above that, we have the 50 EMA line (blue) at $10,700 and the 0.382 Fibonacci level at $10,836 as the next major targets if BTC continues retracing back towards $11,000. This particular Fibonacci level is also being reinforced by the 200 EMA, which could make a breakout above this line even more difficult.
Looking below, we have the primary channel support (yellow line), which recently caught the bottom of the aforementioned crash yesterday at around $10,290. This will continue to be a major area to watch as it has not been closed beneath since April 26 on the daily chart. If this were to happen, it should be construed as a significant bearish warning.
If prices continue to break to the downside, then the main support zone (green) between $10,200 and $10,000 should provide a safety net for bitcoin’s price from falling into the CME gap below.
BTC falling into the oversold region on the 4-hour RSI should also create some buying pressure to help prop up prices if there is another sharp decline soon.
Total market capital: $335 billion
Bitcoin market capital: $193 billion
Bitcoin dominance: $57.7%
*Data by Coingecko.
Bitstamp BTC/USD Daily Chart
Bitstamp BTC/USD 4-Hour Chart
Binance Futures 50 USDT FREE Voucher: Use this link to register & get 10% off fees and 50 USDT when trading 500 USDT (limited – first 200 sign-ups & exclusive to CryptoPotato).
Click here to start trading on BitMEX and receive 10% discount on fees for 6 months.
Disclaimer: Information found on CryptoPotato is those of writers quoted. It does not represent the opinions of CryptoPotato on whether to buy, sell, or hold any investments. You are advised to conduct your own research before making any investment decisions. Use provided information at your own risk. See Disclaimer for more information.
Cryptocurrency charts by TradingView.