- Ethereum climbed by 4.2% today as it reached the $380 mark.
- The cryptocurrency broke a descending triangle pattern on the short term charts.
- Against Bitcoin, ETH is starting to recover as it climbed back above 0.035 BTC.
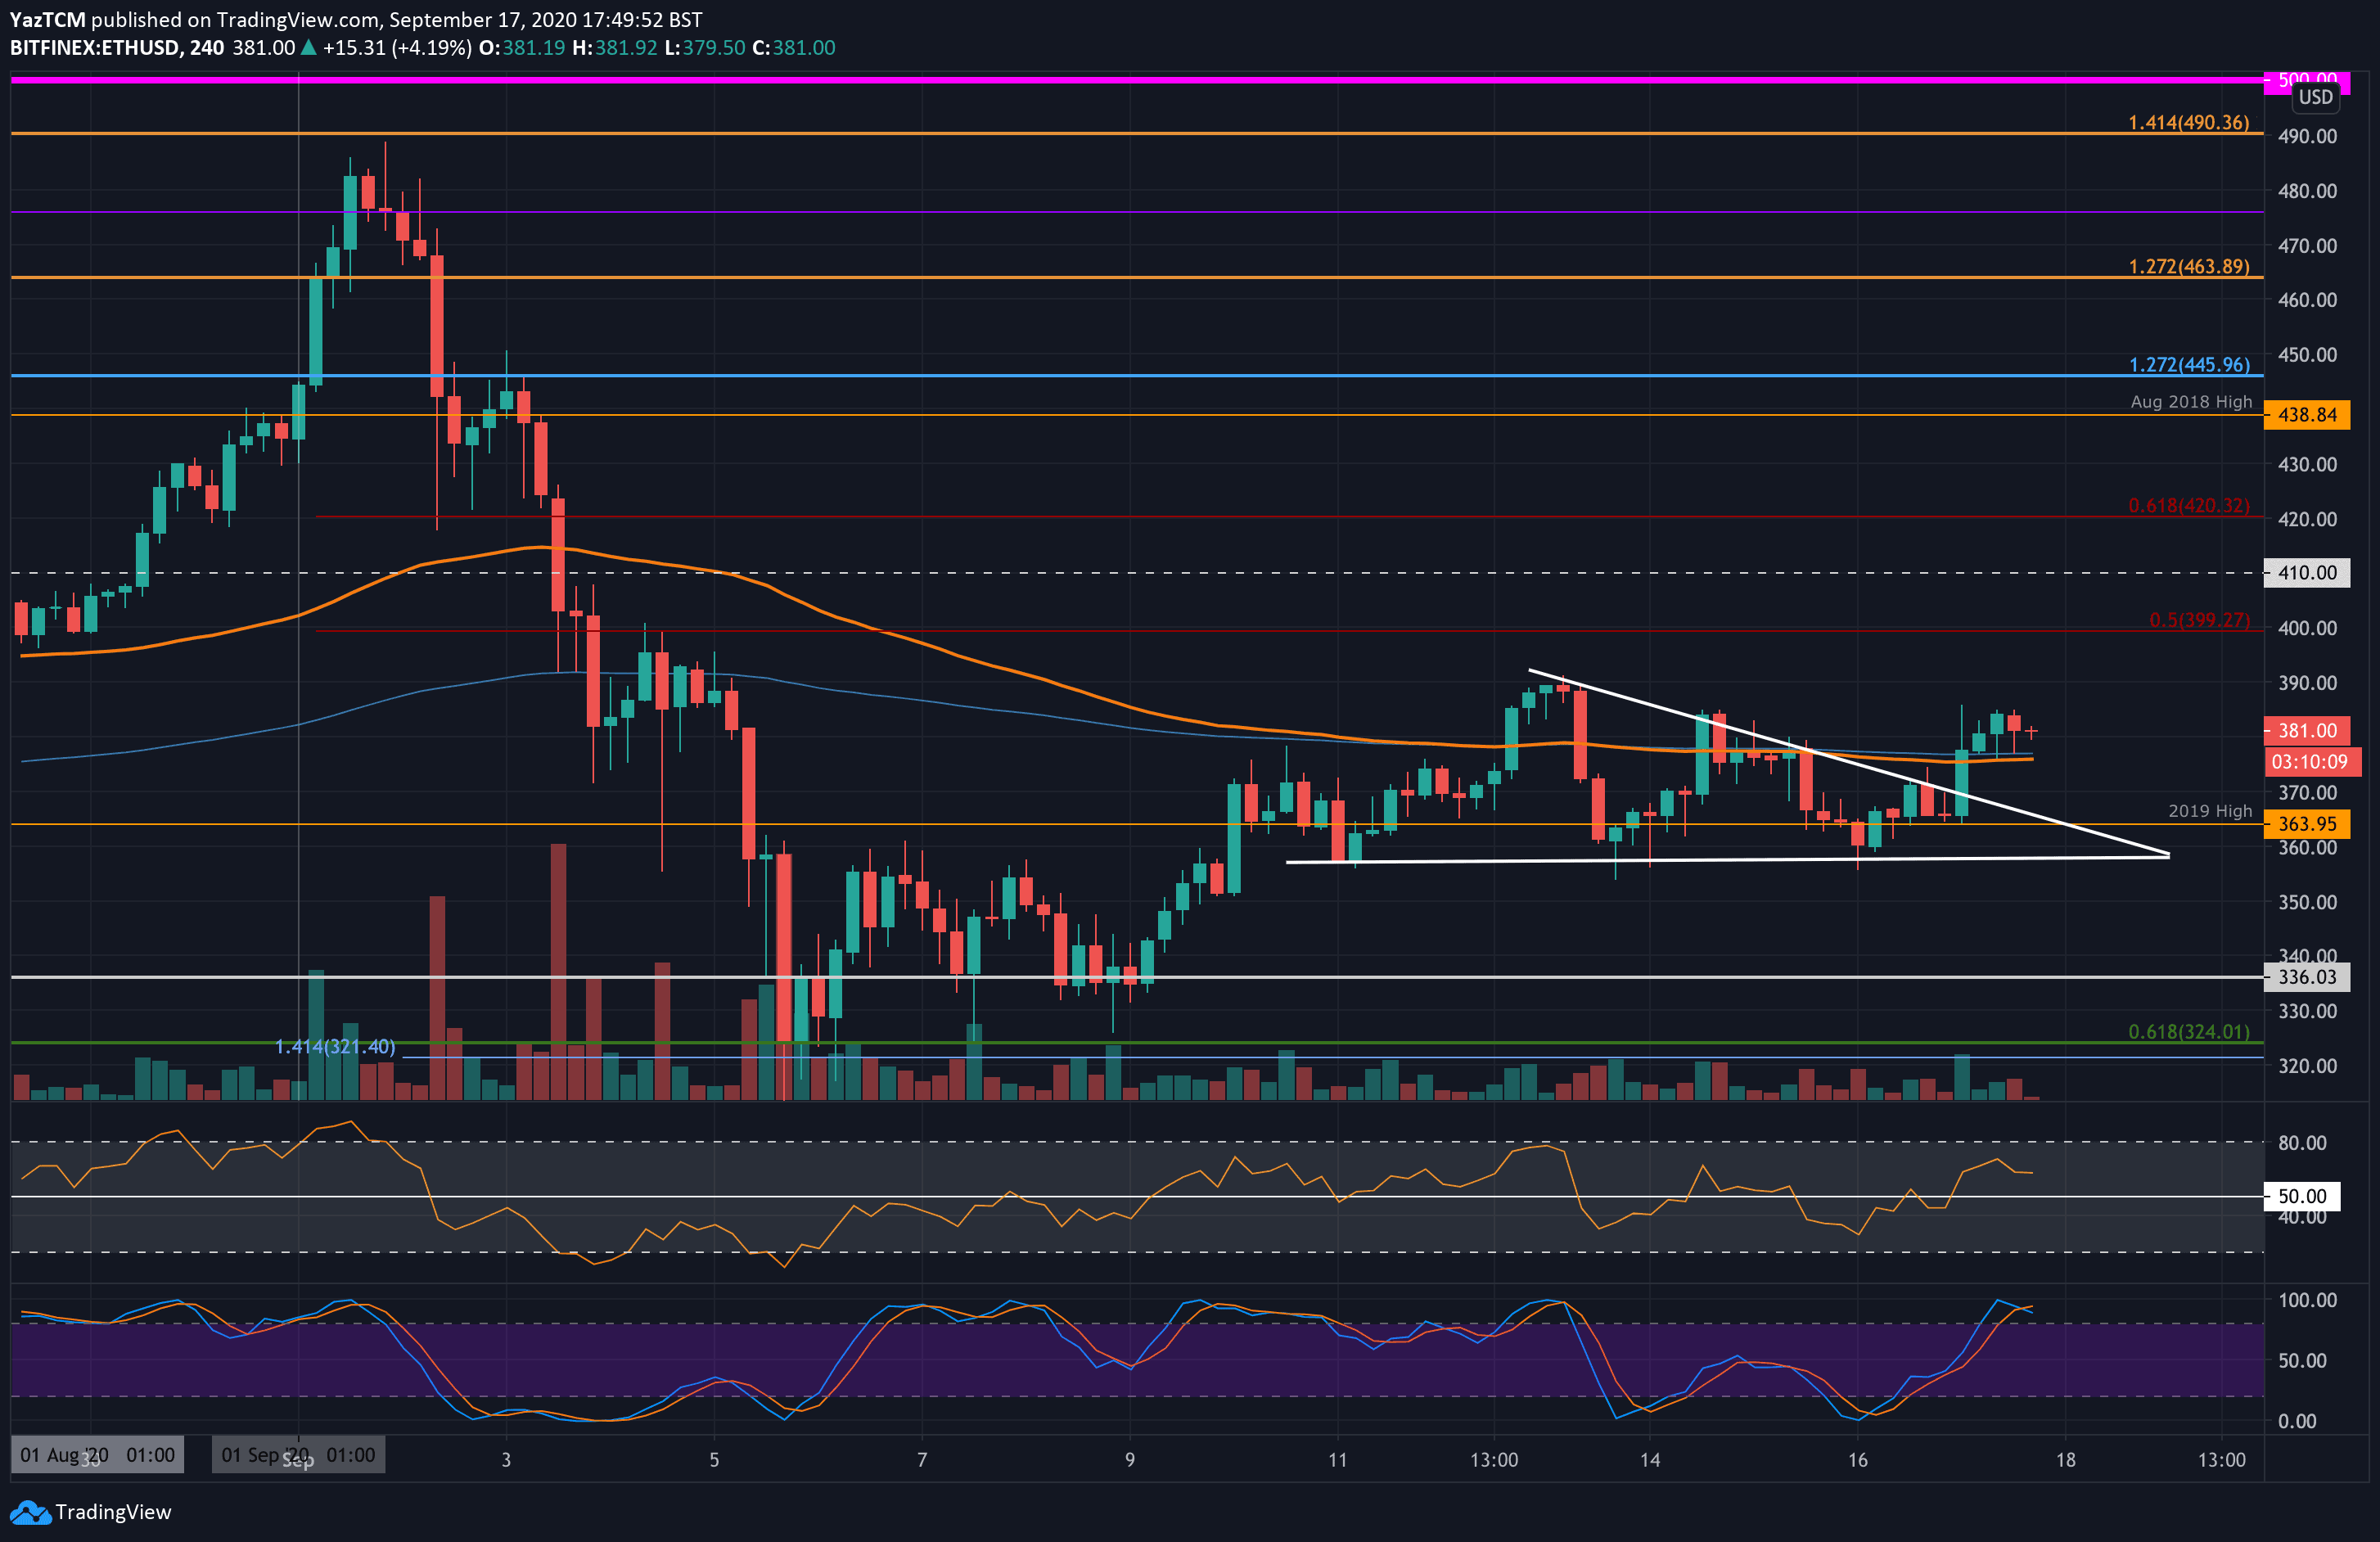
ETH/USD – Etheruem Bulls Break Descending Triangle.
Key Support Levels: $364, $350, $336.
Key Resistance Levels: $390, $400, $410.
Ethereum dropped into the support at $364 (2019 High) at the start of this week, and the bulls have defended this level over the past 5-days. The cryptocurrency has been rangebound between $380 and $364 during this time, as it started to form a descending triangle on the 4HR chart.
Today, Ethereum managed to penetrate above the upper boundary of this descending triangle, which might kick-start another bullish run back above $400;
The break above this resistance is the first signal needed for a bullish press higher. Next, ETH has to break beyond $390 before hitting $400 and beyond.
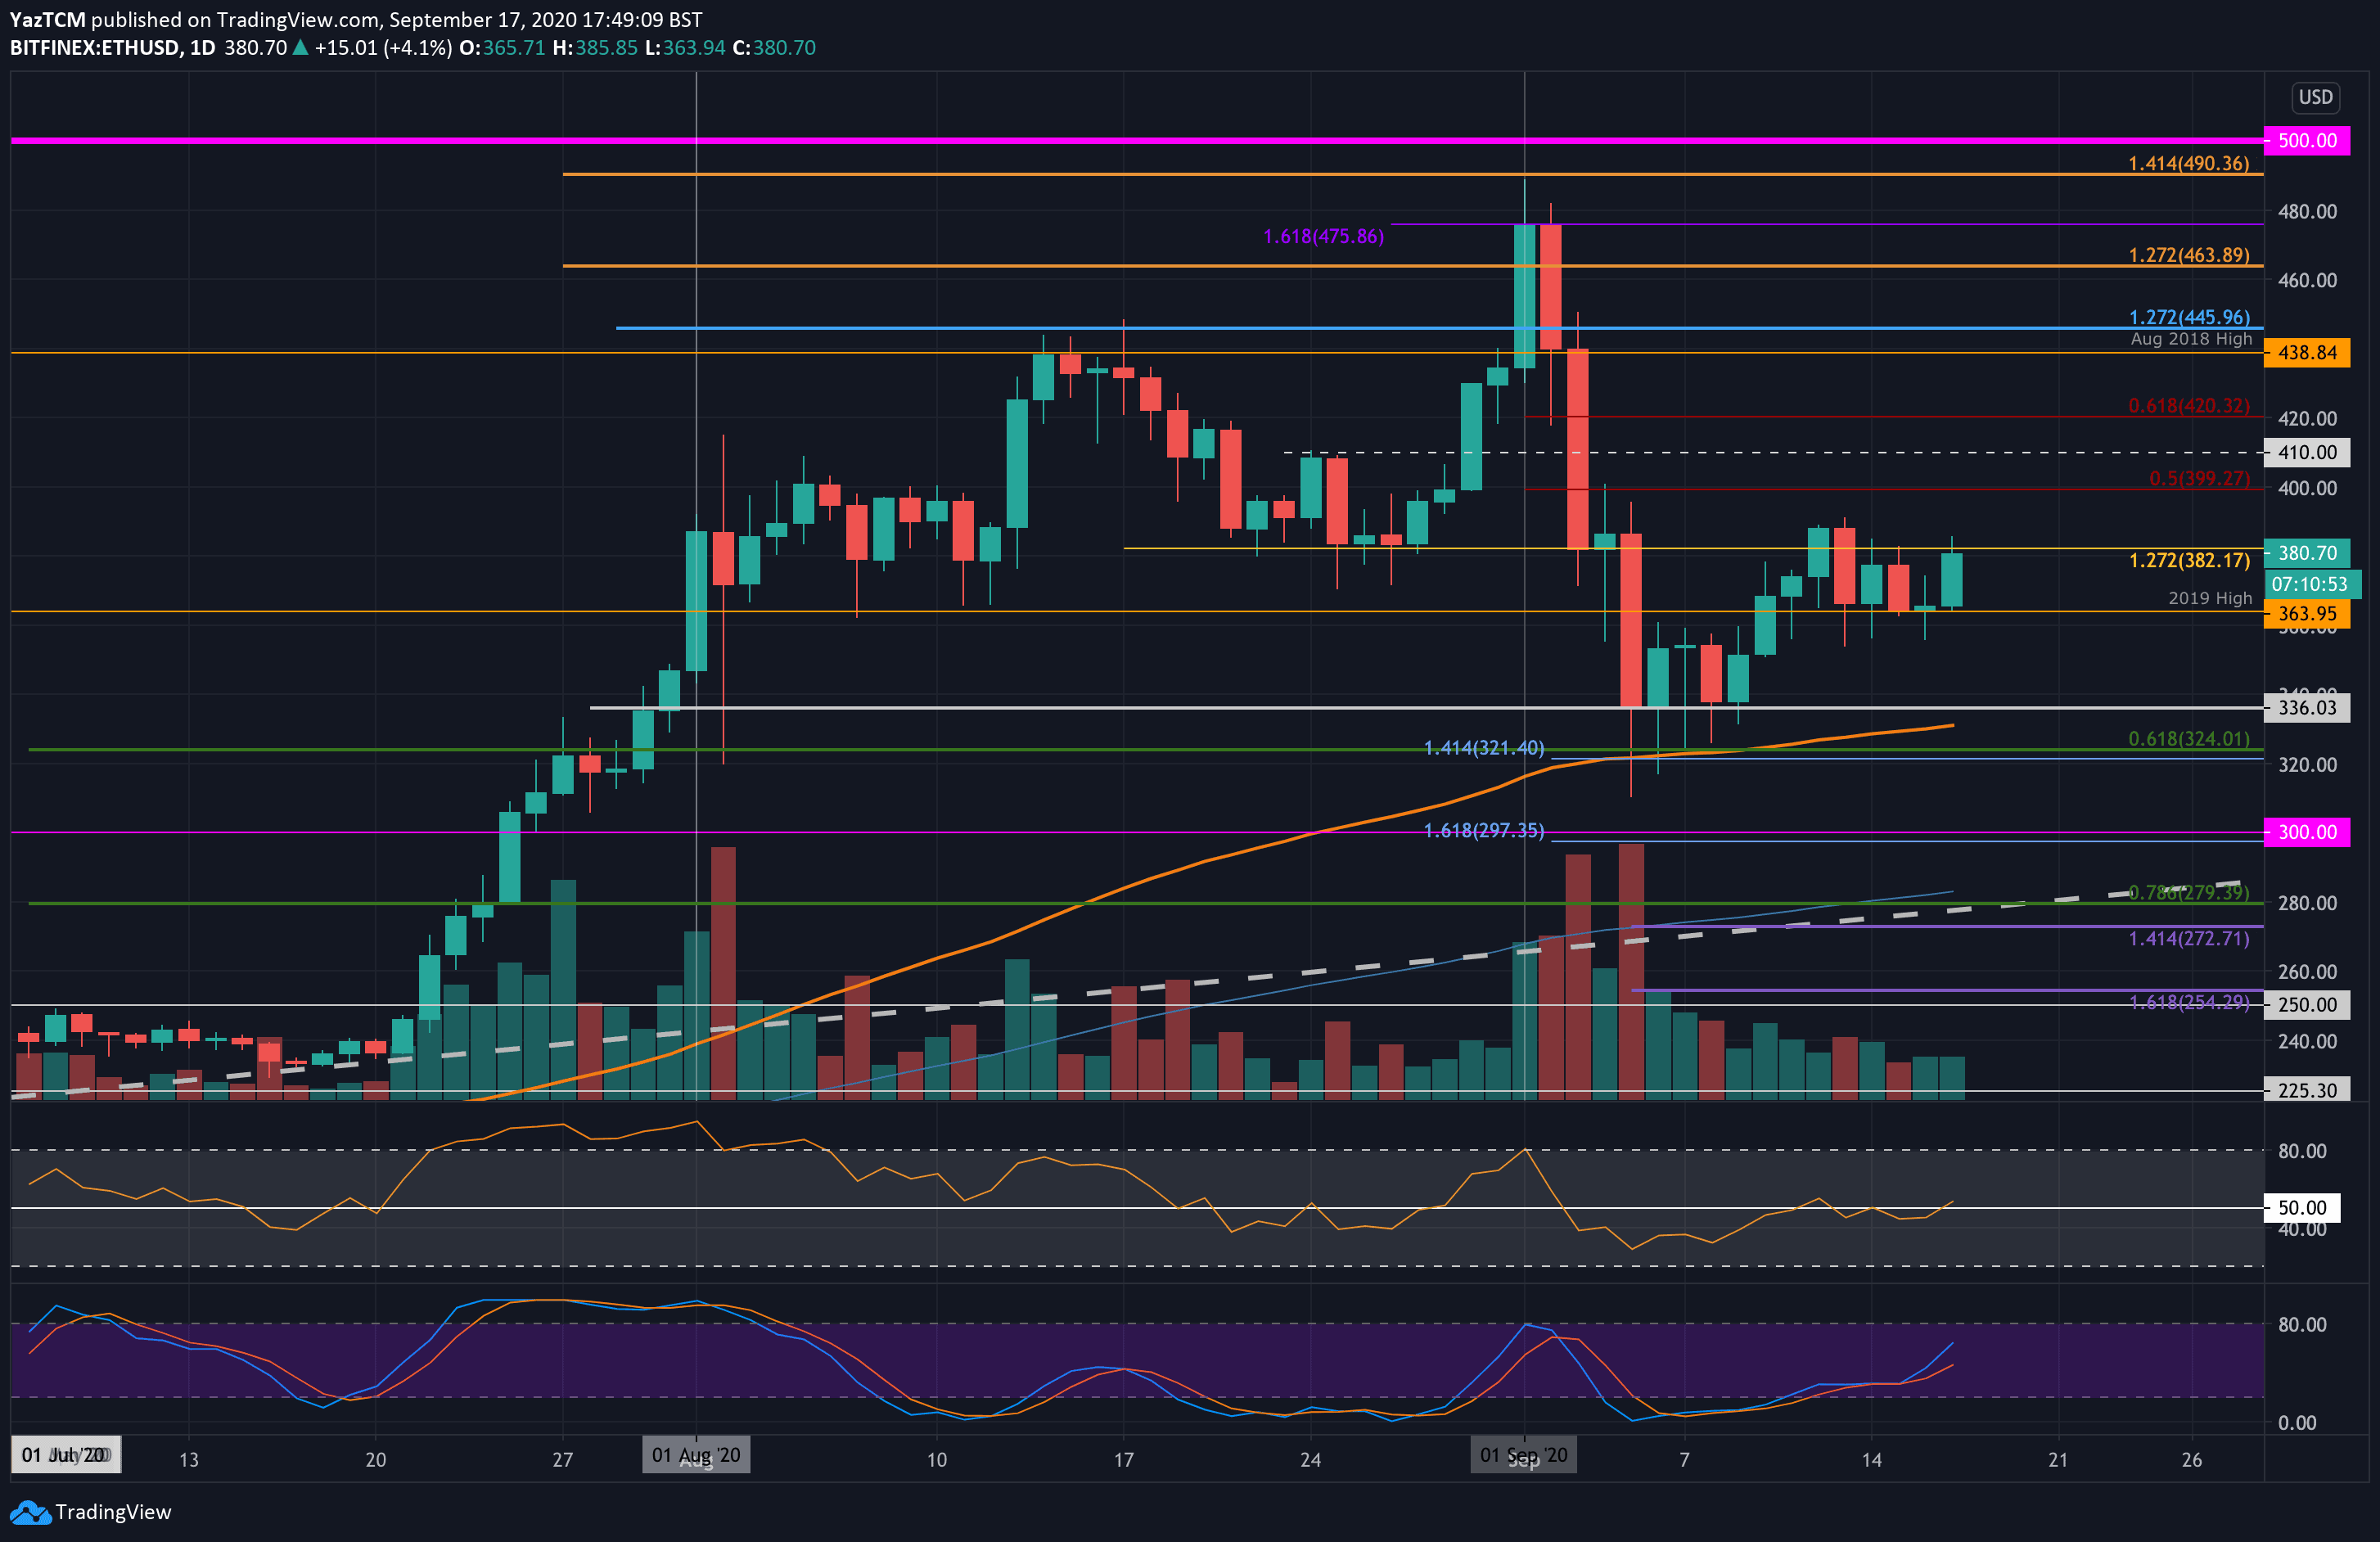
On the following daily chart, it is clear how well the $364 (2019 high) level has been supporting the market;
ETH-USD Short Term Price Prediction
Looking ahead, if the buyers continue to grind higher, the first level of resistance lies at $390. This is followed by $400, $410, and $420 (bearish .618 Fib Retracement). Additional resistance then lies at $438 (August 2018 high) and $450.
On the other side, the first level of support lies at $364 (2019 highs). Beneath this, support lies at $350, $336, and $324 (.618 Fib Retracement).
The RSI poked itself above the mid-line, which indicates the buyers are attempting to gain control of the market momentum – another signal that ETH could be pushing back above $400 soon.
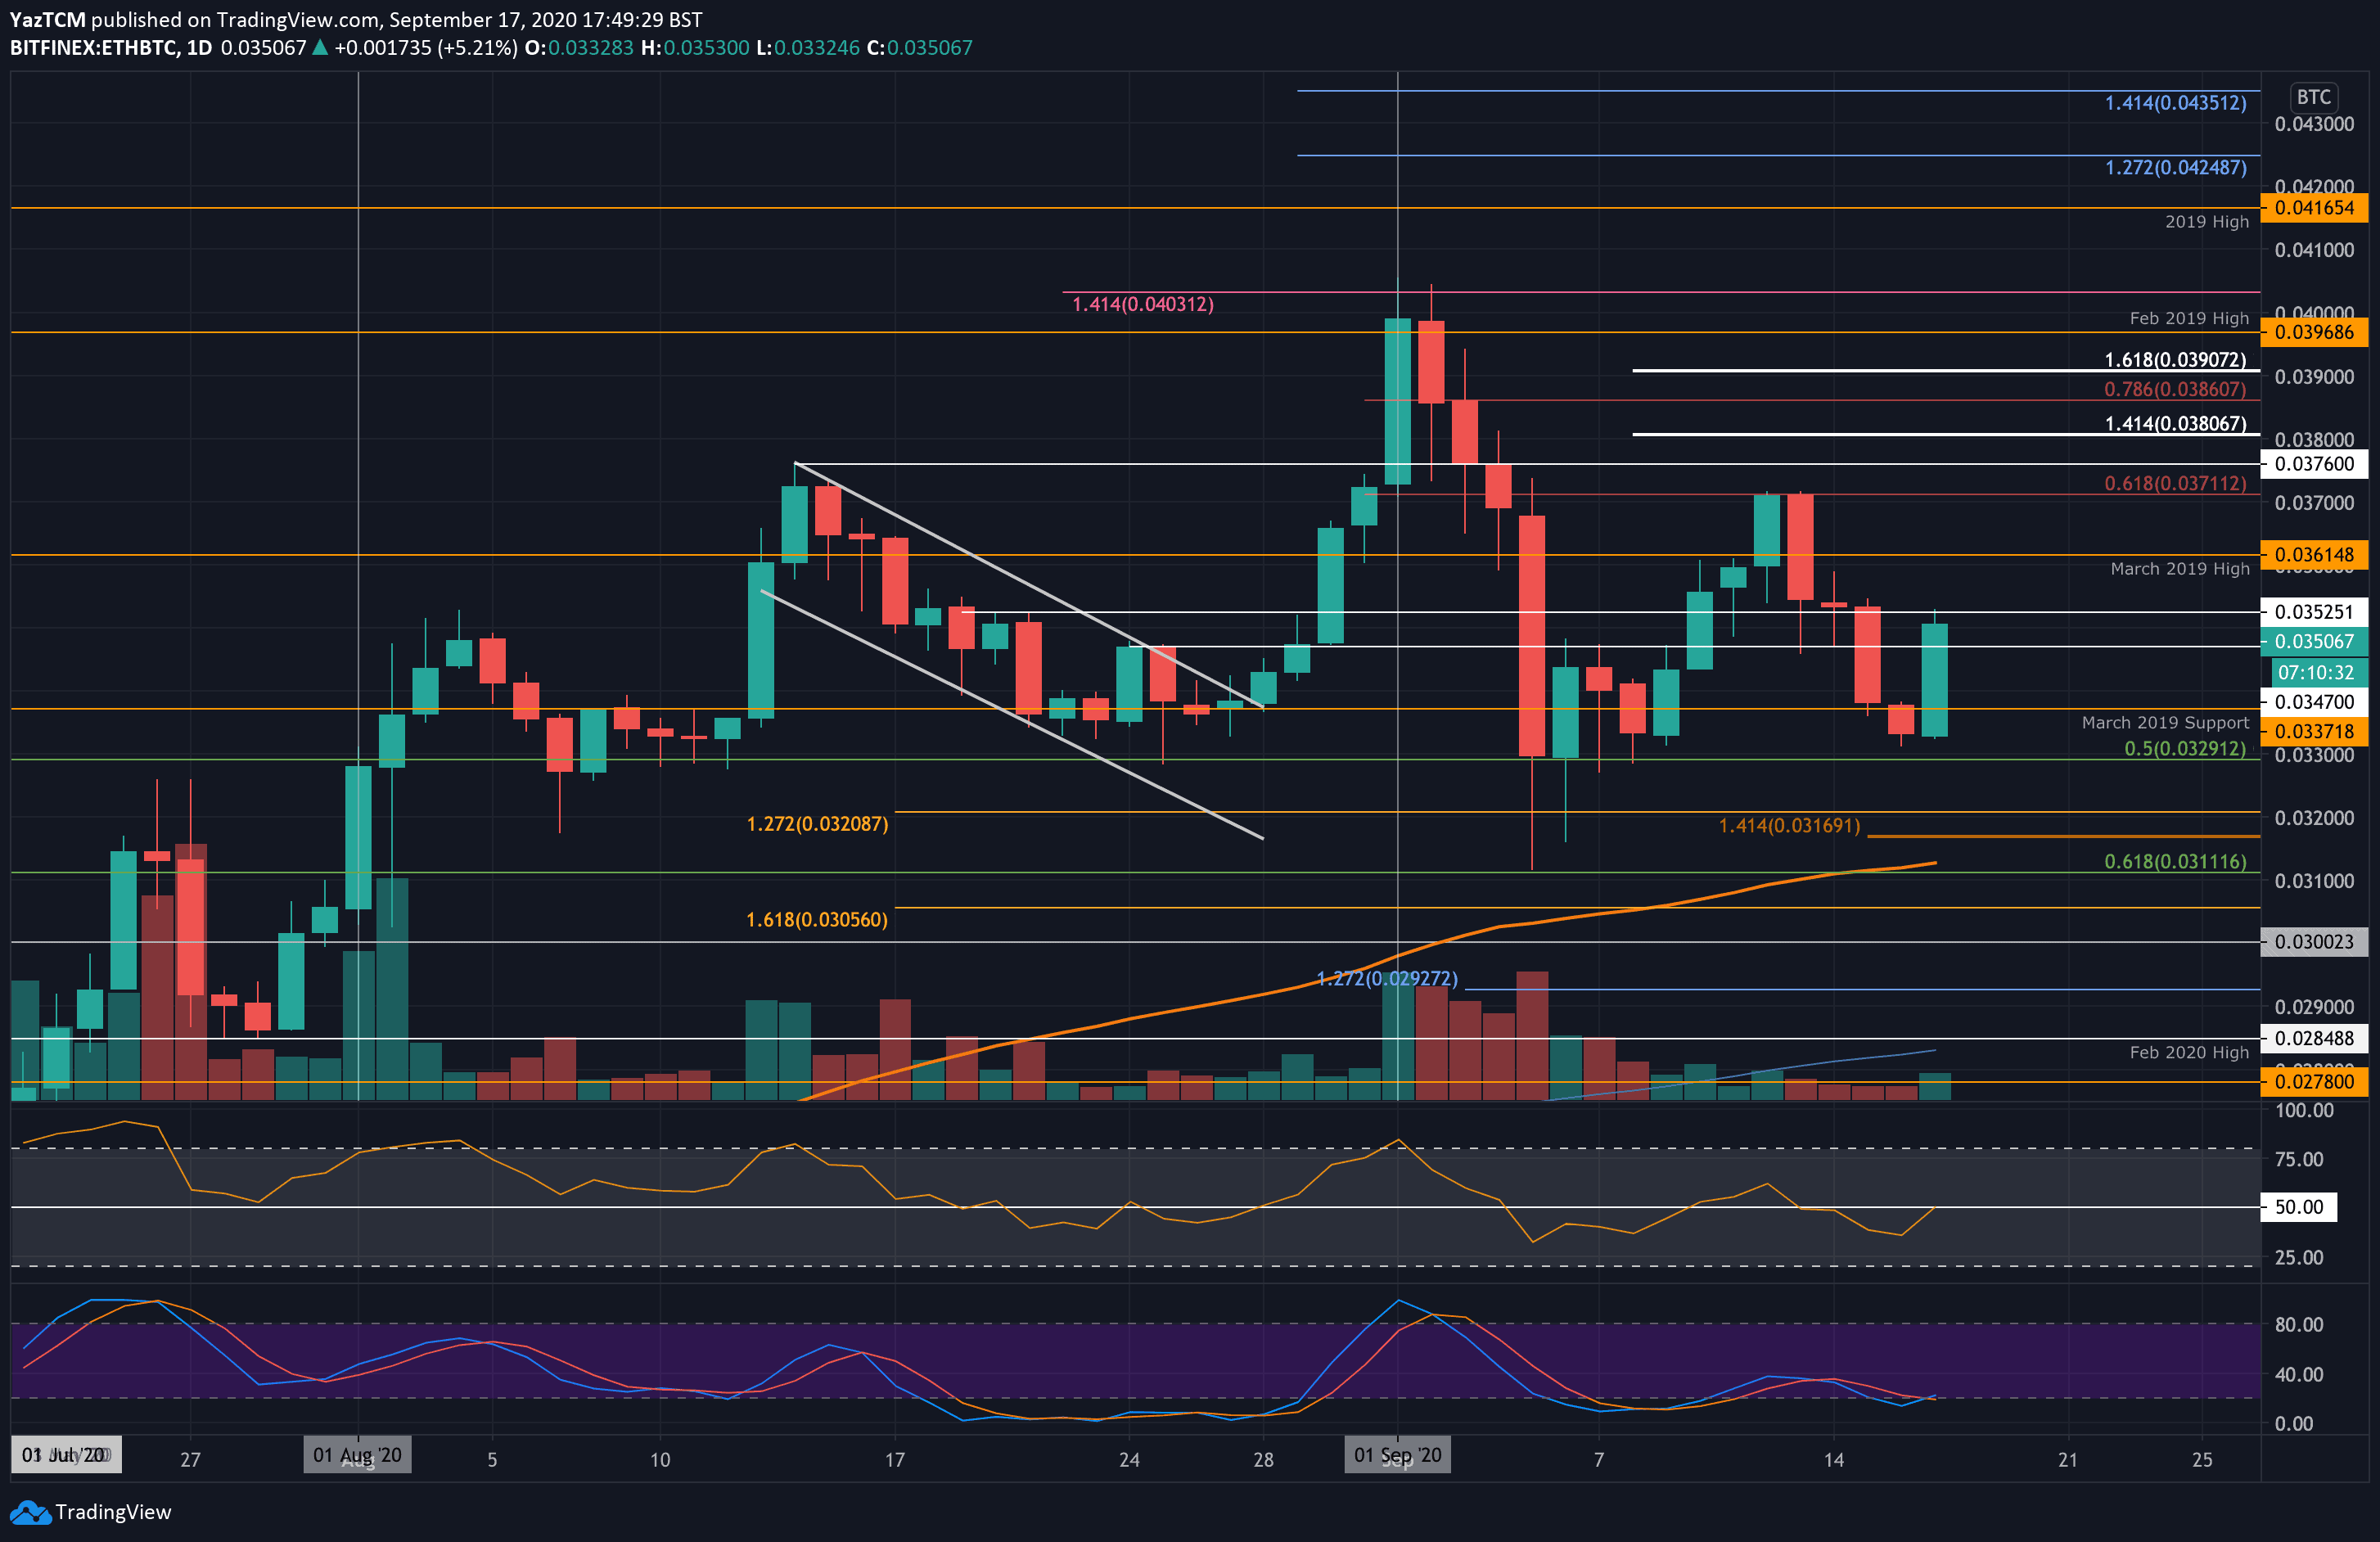
ETH/BTC – Ethereum Weakness Starts To Fade
Key Support Levels: 0.0347 BTC, 0.0337 BTC, 0.0329 BTC.
Key Resistance Levels: 0.0361BTC, 0.0371 BTC, 0.0376 BTC.
Against Bitcoin, Ethereum was showing weakness throughout the week after it rolled over from the resistance at 0.0371 BTC (bearish .618 Fib Retracement) on Sunday. It continued to fall throughout the week until it found support at the 0.0332 BTC level yesterday.
Today, the bulls have pushed higher as they attempt to break the resistance at 0.0352 BTC.
ETH-BTC Short Term Price Prediction
Moving forward, once the bulls break 0.0352 BTC, the first level of strong resistance lies at 0.0361 BTC (March 2019 Highs). This is followed by resistance at 0.0371 BTC (bearish .618 Fib Retracement), 0.0376 BTC, and 0.0386 BTC (bearish .786 Fib Retracement).
On the other side, support lies at 0.0347 BTC, 0.0337 BTC, and 0.0329 BTC (.5 Fib Retracement).
Likewise, the RSI here is trying to breach the mid-line as the buyers battle to take control of the market momentum. It will need to push beyond the mid-line for ETH to go higher against BTC.
Click here to start trading on BitMEX and receive 10% discount on fees for 6 months.
Disclaimer: Information found on CryptoPotato is those of writers quoted. It does not represent the opinions of CryptoPotato on whether to buy, sell, or hold any investments. You are advised to conduct your own research before making any investment decisions. Use provided information at your own risk. See Disclaimer for more information.
Cryptocurrency charts by TradingView.